|
Number of nucleolus in the nucleus |
% of the cells in population* |
Nucleus |
Summarized nucleolus |
||||
|
quantity of DNA |
area |
perimeter |
quantity of DNA |
Area |
perimeter |
||
|
1 |
9,8 |
62,5±7,7 |
64,5±9,1 |
19,5±0,7 |
9,5±0,7 |
5,7±0,7 |
6,5±0,7 |
|
2 |
13,2 |
64,6±20 |
75,1±14 |
23,6±3,1 |
9,8±2,3 |
8,3±1,5 |
7,7±2,1 |
|
3 |
25,3 |
67,0±16 |
71,1±12 |
21,1±2,7 |
11,1±3 |
8,9±2,1 |
10,1±2 |
|
4 |
37,5 |
62,8±11 |
63,6±9 |
19,8±1,9 |
10,8±4 |
9,3±2,0 |
12,5±5 |
|
5 |
7,8 |
62,9±9 |
83,1±9,6 |
23,3±2,3 |
9,4±2,7 |
10,4±2,3 |
13,8±2,6** |
|
6 and more |
6,4 |
61,4±4,4 |
82,2±21 |
21,5±4,5 |
9,6±1,1 |
9,2±2,5 |
12,7±2,1** |
* Without the account the mitosis, dead and nonnucleolar cells
**Significant in comparison with 1 nucleolar cells at 6-nucleolar cells
t = 2,80 and at 5 nucleolar cells t = 2,70 (p < 0,01).
The difference between the minimal and
maximal measurements of the quantity of DNA in the nucleus and the nucleolus of
cells of the line NIH 3T3 in control group (table 1) was less than 10% and less
than 15% accordingly. It testifies that the difference between the minimal and
maximal measurements of the quantity of DNA in the nucleus and the nucleolus is
insignificant in control group. Under the influence of virus the minimal and
maximal measurements of the DNA quantity increase in the nucleus approximately
30% and in the nucleolus more than 25% (table 2).
|
Number of nucleolus in the nucleus |
% of the cells in population* |
Nucleus |
Summarized nucleolus |
||||
|
quantity of DNA |
area |
perimetr |
quantity of DNA |
area |
perimetr |
||
|
1 |
6,5 |
115±21 |
92,1±5,6 |
27,1±2,8 |
17,1±1 |
13,5±0,7 |
7,1±1,4 |
|
2 |
12,2 |
101±27 |
66,3±27 |
19,3±4,9 |
17,6±3 |
10,1±3,6 |
8,3±2,5 |
|
3 |
18,75 |
124±44 |
93,5±27 |
23,5±4,3 |
20,1±8 |
12,5±4,7 |
11,5±3,2 |
|
4 |
35,9 |
98±30 |
72,1±14 |
21,6±4,0 |
15,9±6 |
10,8±3,3 |
12,6±2,9 |
|
5 |
23,9 |
114±37 |
83,4±20 |
23,7±2,8 |
17,1±5 |
11,64±3 |
13,9±2,4*** |
|
6 and more |
2,75 |
97±20,6 |
81,1±19 |
23,0±3,6 |
15,4±7 |
11,1±3,6 |
14,2±2,2** |
* Without the account the mitosis, dead and nonnucleolar cells
** Significant in comparison with 1 nucleolar cells t = 2,72, p
< 0,01
*** Significant in comparison with 1 nucleolar cells
t = 2,44, p < 0,02
It necessary to
note, that under the influence of acute viral infection the average quantity of
DNA in a nucleus of cells of a line NIH 3T3 was significantly increased (control
63,9±9,1 EMC 108,1±14,2
t = 2,62, p < 0,01). Under the action of a virus the quantity of the DNA
in nucleolus was also significantly increased (control 10,4±1,3 EMC 17,13±2,2 t = 2,63, p
< 0,01).
In our experiments we obtained only the
tendency of increasing of the nuclear area (control 69,8±8,6, EMC 80,4±9,3 t = 0,84). There
were not changes of the nuclear perimeters (20,99±2,7-
control 22,56±2,9 - infection).
The one of the parameters of the cells
proliferation speed is the change of the nucleolar area (Derenzini et al. 2000).
Under the influence of the virus on the NIH 3T3 cells we calculated the tendency
of the increasing of the nucleolar area (8,8±0,9 -
control, 11,4±1,7 - action EMC t = 1,35).
Also we investigated the concentration of DNA
in a nucleus and nucleolus. Was shown that under the influence of EMC the
concentration of DNA in a nucleus was significantly increased (control 0,84±0,097, EMC action 1,31±0,105
t = 3,29, p < 0,01). The changes of the DNA concentration in the nucleolus were
insignificant.
|
Number of nucleolus in the nucleus |
Nucleolus/nucleus |
||
|
DNA |
area |
perimeter |
|
|
1 |
0,15±0,01 |
0,09±0,01 |
0,33±0,04 |
|
2 |
0,15±0,01 |
0,11±0,02 |
0,33±0,01 |
|
3 |
0,16±0,05 |
0,13±0,2 |
0,47±0,08 |
|
4 |
0,17±0,06 |
0,15±0,05 |
0,63±0,07* |
|
5 |
0,15±0,05 |
0,13±0,03 |
0,59±0,1** |
|
6 and more |
0,16±0,06 |
0,11±0,02 |
0,59±0,08* |
* Significant in comparison with 1 and 2 nucleolar cells t = 2,9, t
= 2,8, p < 0,01
** Significant in comparison with 1
nucleolar cells t = 2,04, p < 0,05
As
follows from tables 3 and 4 the DNA quantities in the nucleolus/nucleus ratio do
not depend from the nucleolus number in the nucleus in the control (average
meaning in population 0,161±0,015) and in infection
(average meaning in population 0,158±0,02). These data
were obtained with taking in account of the percent of each type of cells in the
population (tables 1 and 2). The significant difference in the nucleolus/nucleus
ratio was absent not only in population, but also in individual cells.
|
Number of nucleolus in the nucleus |
Nucleolus/nucleus |
||
|
DNA |
area |
Perimeter |
|
|
1 |
0,15±0,01 |
0,15±0,002 |
0,26±0,03 |
|
2 |
0,17±0,01 |
0,15±0,02 |
0,43±0,07 |
|
3 |
0,16±0,05 |
0,13±0,04 |
0,49±0,1 |
|
4 |
0,16±0,06 |
0,15±0,04 |
0,6±0,1* |
|
5 |
0,15±0,05 |
0,15±0,04 |
0,59±0,1* |
|
6 and more |
0,16±0,06 |
0,14±0,05 |
0,64±0,1** |
*
Is significant in comparison with 1 nucleolar cells t = 3,23, t =
3,1 p < 0,01
** Is significant in comparison with 1
nucleolar cells t = 3,6, p < 0,001
Under the lytic influence of the EMC the
areas in the nucleolus/nucleus ratio of the cell population showed the only
tendency to the increasing (0,129±0,02 - control,
0,146±0,02 - experience).
According to the data of tables 3 and 4 there
is the only one significant difference between cells NIH 3T3 with the various
quantity of nucleolus in nucleus. It is the ratio of the sums of perimeters of
the «total» nucleolus to the nucleus. These data demonstrate almost direct
dependence with the increase of the nucleolus quantity as in the experiment as
in the control.
|
|
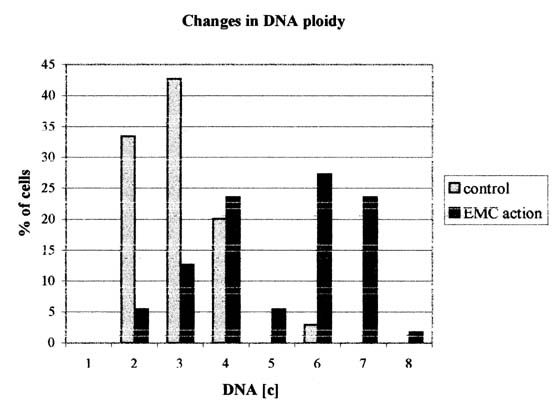
Figure 1. Distribution of the nucleus by the DNA ploidy (in "c" units) in NIH 3T3 cells
Fig 1 summarizes the changes of the DNA
ploidy indices in normal condition and under the influence of EMC. The present
results indicate that under the influence of the virus there are the significant
changes in ploidy of NIH 3T3 cells, ploidy was increased under the virus
influence (2,24 "c" in control 3,79 "c" - EMC infection). Percentage of euploid
cells was not changed, (36,3±3,2 in control 36,4±4,2 EMC action). As a result of infection in euploid
population the percentage of 2c cells decreases, but the persentage of 4c cells
increases. As well in euploid population 8c cells appears.
Our data demonstrate the absence of increase
of the total nucleolar DNA with the increase of the number of nucleolus in the
nucleus. The quantity of each nucleolar DNA decreases while the nucleolus number
in the nucleus increases.
Conclusions
* The quantity of the nucleolus does not depend on the quantity of DNA in a nucleus, as under the influence of virus as in intact cells of NIH 3T3
* The quantity of DNA in the nucleolus in direct proportion with the quantity of DNA in a nucleus as in the experiments as in the intact cells.
* The relation of the quantity of DNA in the system nucleolus/nucleus is stabile state as in the norm as under the influence of a virus.
* The ratio of the sums of the nucleolar perimeters to the nuclear perimeter is the significant factor which increases linearly while the number of the nucleoli in a nucleus increases in the intact cells and under the action of the EMC virus.
* As the quantity of DNA in a nucleus as well the concentration of DNA in a nucleus are significantly increased under the action of the lytic EMC virus.
* There are no changes of the percentage of euploid cells under the influence of the viral infection.
* There is no the increase of the summarized nucleolar DNA while the number of the nucleolus increases in a nucleus of NIH 3T3 cells as under the influence of a virus as in intact cells.
* In the process of the increasing of the number of nucleolus in NIH 3T3 cells there is the decresing the quantity of DNA in each of nucleoli in nucleus.
Cancer Research Center,
Yerevan
Institute of molecular biology NSA RA
References
1. Field D., Fitzerald P., Sin F.
Nucleolar silverstaining patterns rellated to cell cycle
phase and cell generation of PHA-stimulated lymphocytes. Cytobios. 1984. vol 41.
p 23-33.
2. Smetana K., Bush H.
The nucleolus. - In: The cell nucleus. N. Y. 1975, p
126-144.
3. Derenzini M., Trere
D., Pession A., Montanaro L., Sirri V. and Ochs R. L. Nucleolar function and size in cancer cells. American Journal of
Pathology, vol 152, 1291-1297. 1998.
4. Ceccarelli C., Trere D., Santini D., Taffurelli M., Chieco P, Derenzini
M. AgNOR in breast tumours. Micron 2000 Apr; 31 (2)
143-9.
5. Layfield LJ, Liu K,
Dodge R, Barsky Sh. Uterine smooth muscle tumors: utility of
classification by proliferation, ploidy, and prognostic markers versus
traditional histopathology. Arch Pathol Lab Med 2000
Feb;124(2):221-7
6. Hernandez-Verdun D., Derenzini M. Non-nucleosomal
configuration of chromatin in nucleolar organizer regions of metaphase
chromosomes in situ. Eur. J. Cell Biol. 1983. vol 31 p
360-365.
7. Troster H., Spring
H., Meissner B., Shultze P., Trendenburg M. F. Structural
organization of an active, chromosomal nucleolar organizer region (NOR)
identified by light microscopy, and subsequent TEM and STEM electron microscopy.
Chromosoma. 1985. vol 91 p 151-163.
8. Derenzini M., Farabegoli F., and Trere D. Localization of DNA in the fibrillar components of the nucleolus: a
cytochemical and morphometric study. J Histochem Cytochem, vol 41, Issue 6, pp.
829-836, 1993
9. Mirre C.,
Knibiehler B. A re-evalution of the relationships between
the fibrillar centres and the nucleolus organizer regions in reticulated
nucleoli: ultrastructural organization, number and distribution of the fibrillar
centres in the nucleolus of the mouse Sertoli cell. J. Cell Sci. R. 1982. vol
55. p. 261-276.
10. Mirre C.,
Knibiehler B. Quantitative ulatrastuctural analysis of
fibrillar cenres in the mouse: correlation of their number and volume of
nucleolar organizer activity. Protoplasma. 1984. vol. 121. p.
120-128.
11. Howell W. M.
Visualizationof ribosomal gene activity. Silver stains
proteins assosiated with rRNA transcribed from oocyte chromosomes. Chromosoma.
1977. vol. 62. p. 361-367.
12. Canet V, Montmasson MP, Usson Y, Giroud F, Brugal G. Correlation between silver-stained nucleolar organizer region area and
cell cycle time. Cytometry 2001 Feb
1;v.43(2):110-6.
13. Derenzini M., Pession
A., Farabegoli F., Trere D., Badiali M., and Dehan P.
Relationship between interphasic nucleolar organizer regions
and grows rate in two neuroblastoma cell lines. American Journal of Pathology,
1989 v. 134, 925-932.
14. Derenzini M., Trere D., Pession A., Govoni M., Sirri V., Chieco P.
Nucleolar size indicates rapidity of cel proliferation in
cancer tissues. J Pathol 2000 Jun; 191 (2) 181-6.